
How-to Create Column Layouts for Account Schedules in Dynamics NAV

In Dynamics NAV, the Column Layout screen allows you to determine how you want to see the columns on your account schedules. You may define columns that are visible on the financial reports or columns that are strictly used for calculations. This blog will illustrate how to create custom layouts for account schedules in Dynamics NAV.
You may define columns that are visible on the financial reports or columns that are strictly used for calculations. Each line on the Column Layout page represents a column.
Unless otherwise stated, the following examples assume a fiscal calendar year.
Let’s get started! Go to: Departments > Financial Management > General Ledger > Account Schedules. Select the Edit Column Layout Setup button on the ribbon.
Figure 1 – The Edit Column Layout Setup button on the Account Schedule Names list
From the Column Layout screen, click into the Name field.
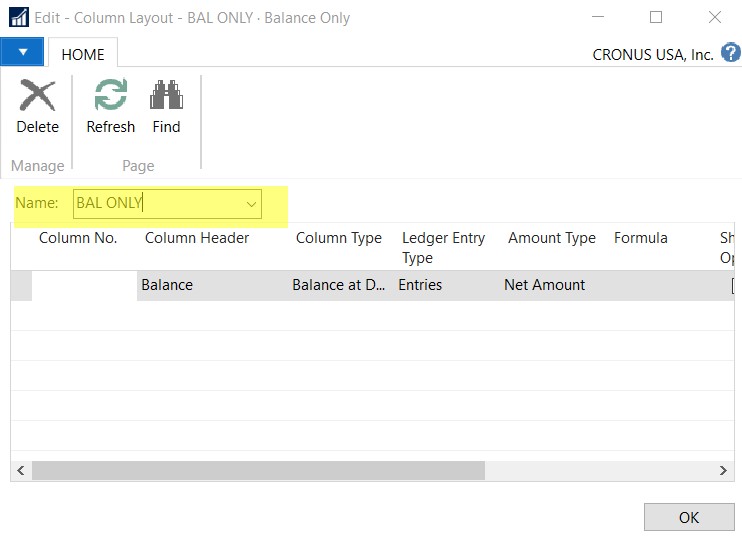
Figure 2 – The Name field on the Column Layout page
From the Column Layout Names page, click the New button on the ribbon. Create a Name and Description for your new column layout.
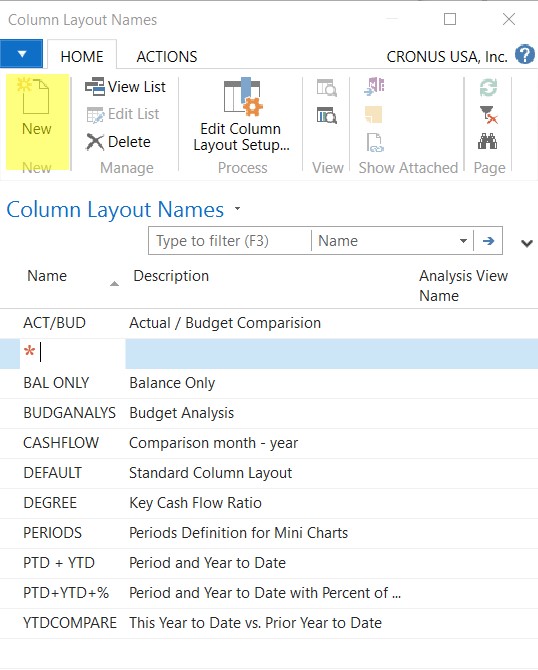
Figure 3 – Creating a new column layout from the Column Layout Names page
Once you have created the new Column Layout Name, select it and complete the line information in the Column Layout page. The following is one example of a simple column layout.
BAL ONLY– Represents the balance at date as determined by the Date Filter used. Used for balance sheet accounts.
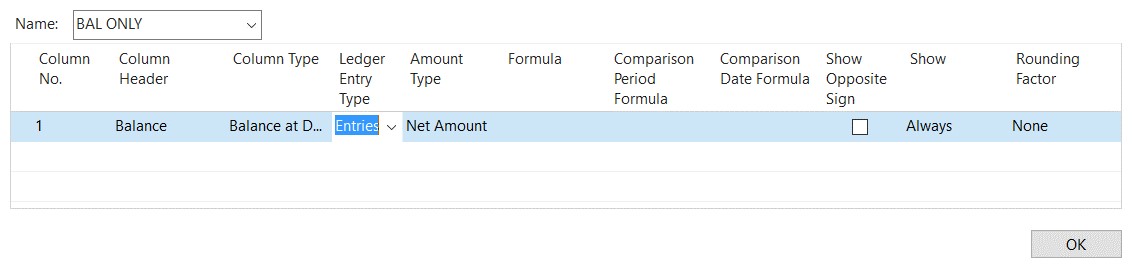
Figure 4 – BAL ONLY Balance Only
The following are samples of additional column layouts that may be created for use with the account schedules.
BAD – Represents the balance at date for each of the twelve months. Typically used for the Balance Sheet.
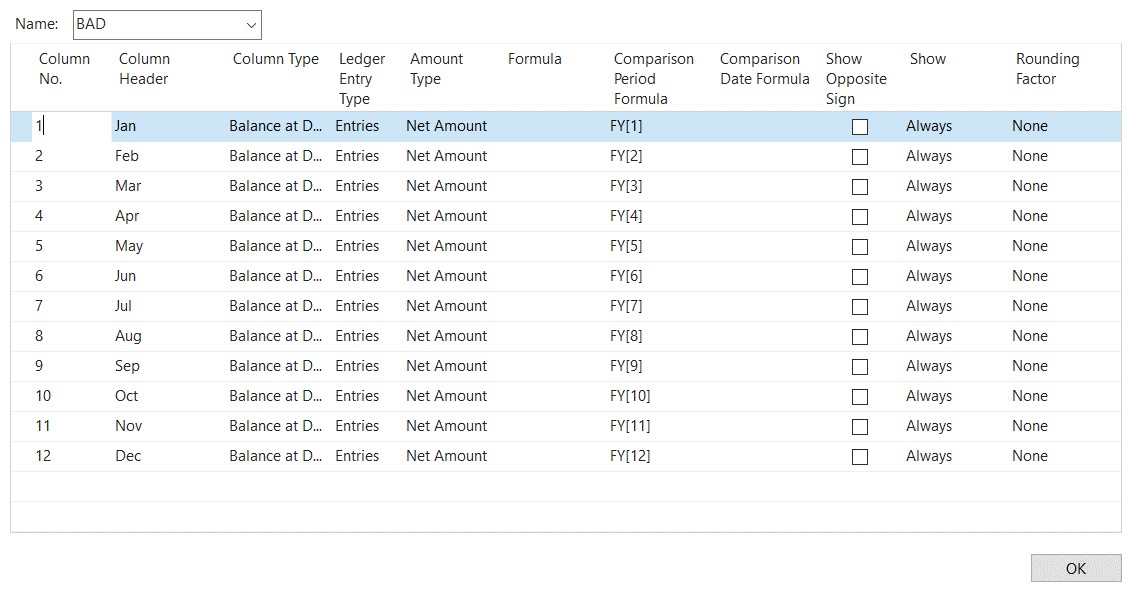
Figure 5 – BAD Balance at Date – 12 Mo of Fiscal Year
BADA (alternative) – Represents the balance at date for each of the twelve months. Typically used for the Balance Sheet.
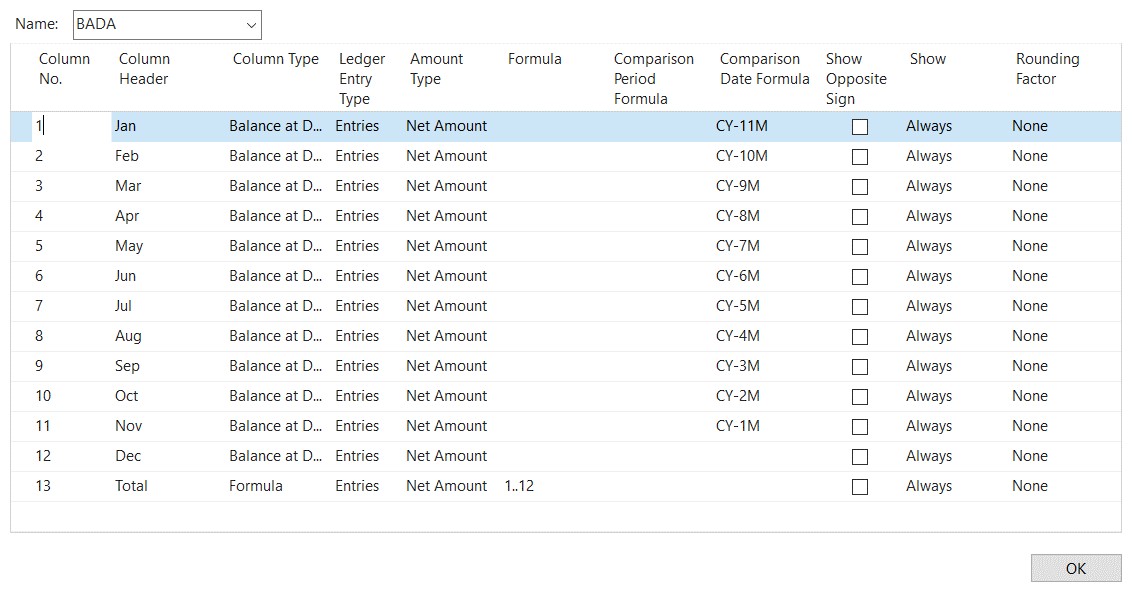
Figure 6 – BADA Balance at Date – 12 Mo of Fiscal Year (Alternative)
BUDGANALYS: Represents the deviation from the budget.
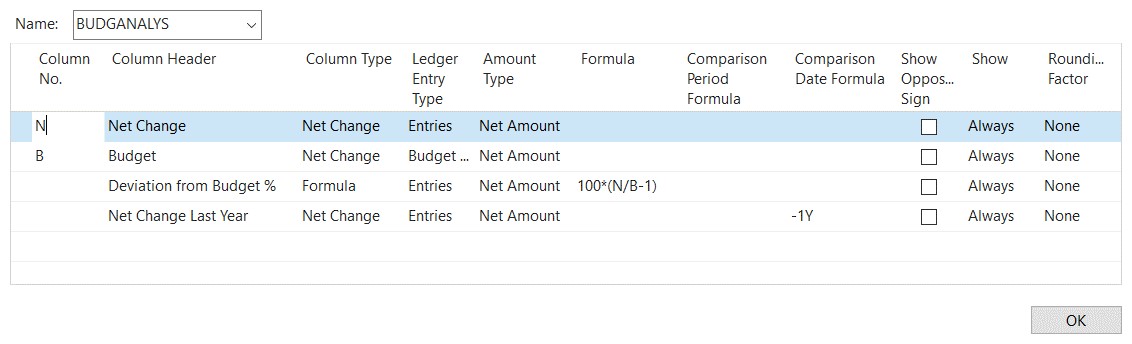
Figure 7 – BUDGANALYS Budget Analysis
CASHFLOW – Represents the statement of cash flow comparing month to year.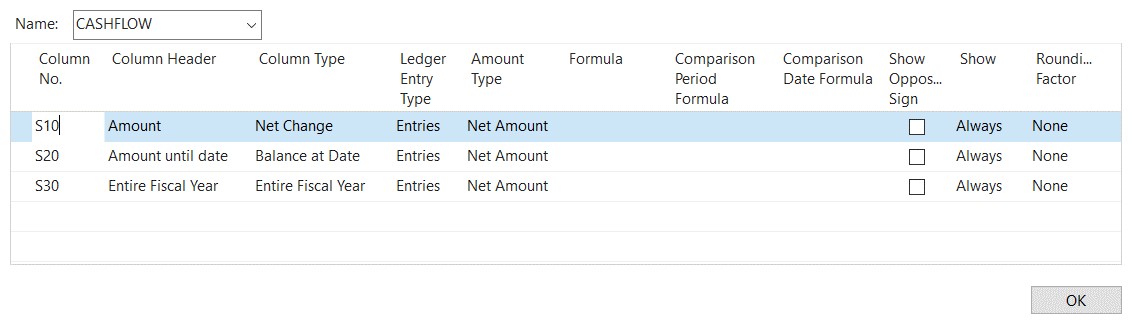
Figure 8 – CASHFLOW Comparison Month -Year
CP – Represents the current period. If the Date Filter is set to April, report displays April. 
Figure 9 – CP Current Period
CPA (alternative) – Represents the current period. If the Date Filter is set to April, report displays April.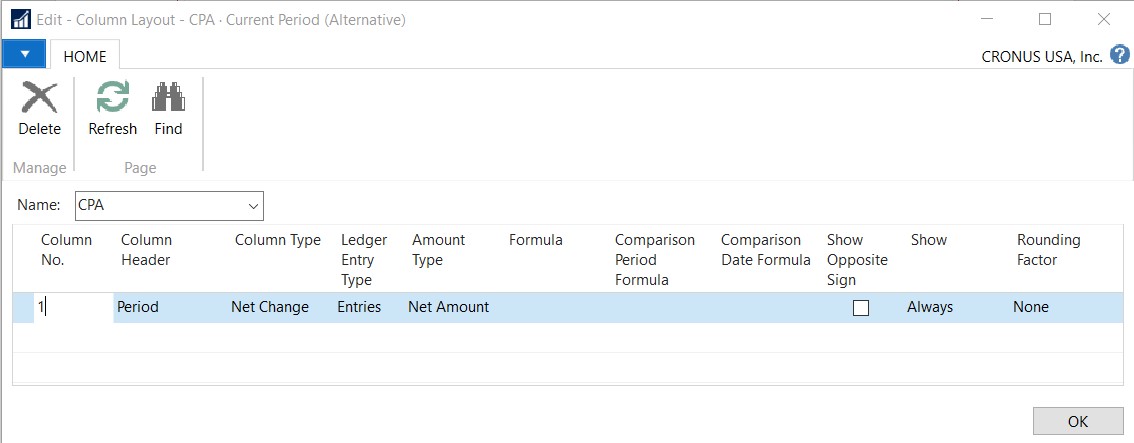
Figure 10 – CPA Current Period (Alternative)
DAY – Represents one day of activity. The Date Filter must be set to one day.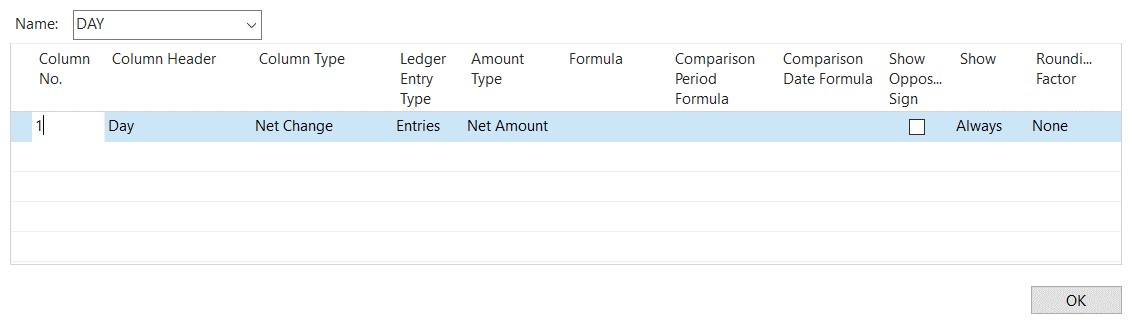
Figure 11 – DAY One day of Activity
DEGREE – Represents the key cash flow ratio.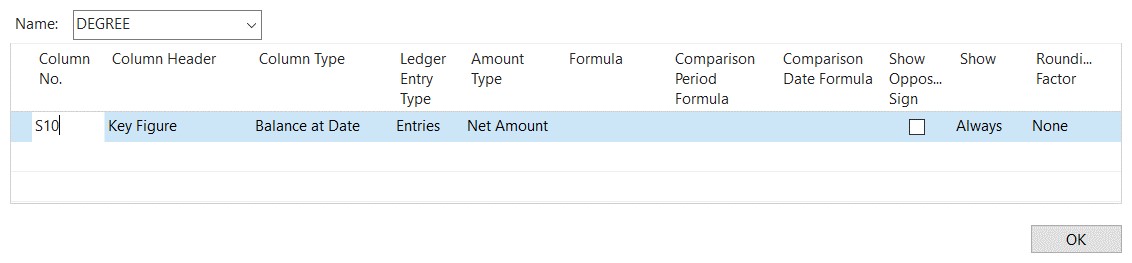
Figure 12 – DEGREE Key Cash Flow Ratio
EY – Represents the entire year. Will display data from January to December regardless of Date Filter.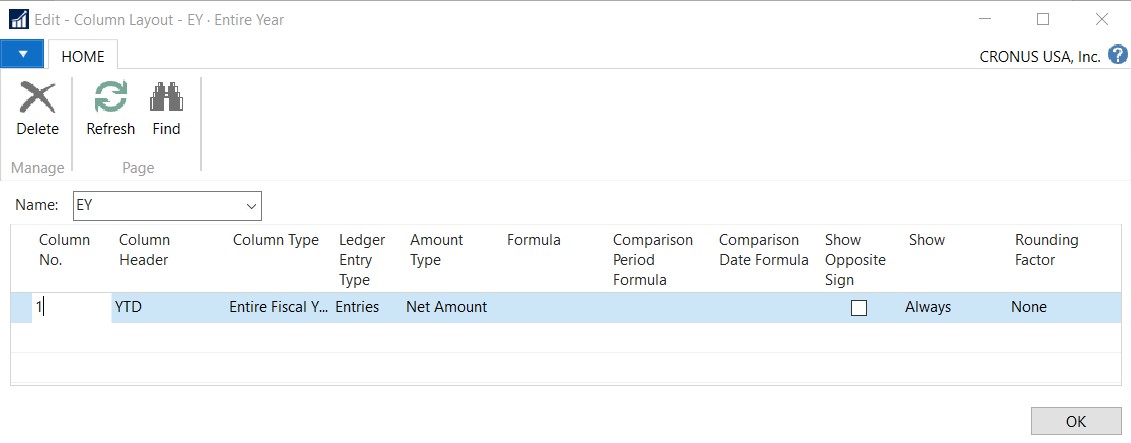
Figure 13 – EY Entire Year
MY – Represents multiple years. Displays four years of activity.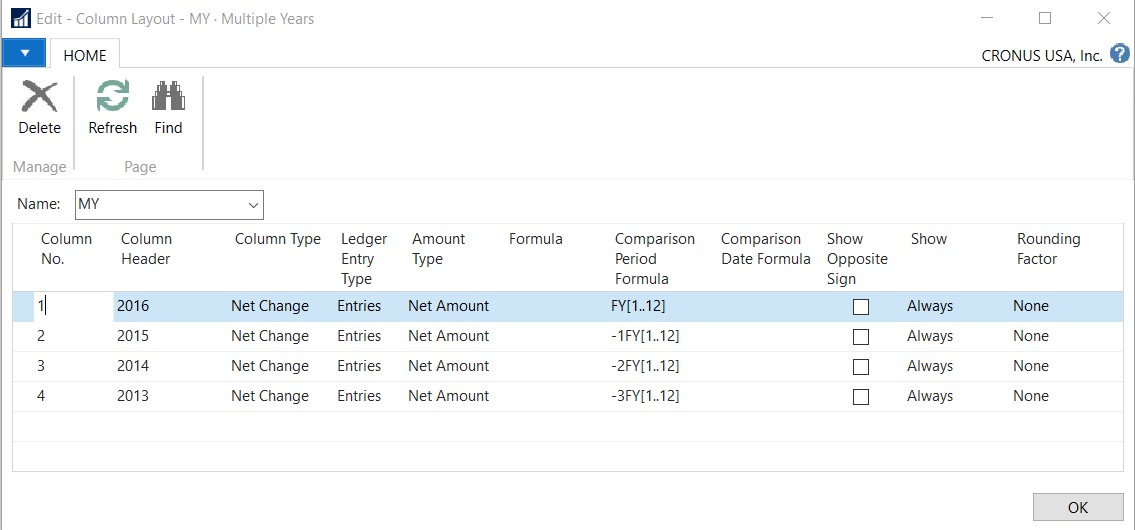
Figure 14 – MY Multiple Years
NC – Represents the net change for 12 months of the fiscal year. This is typically used for income statements.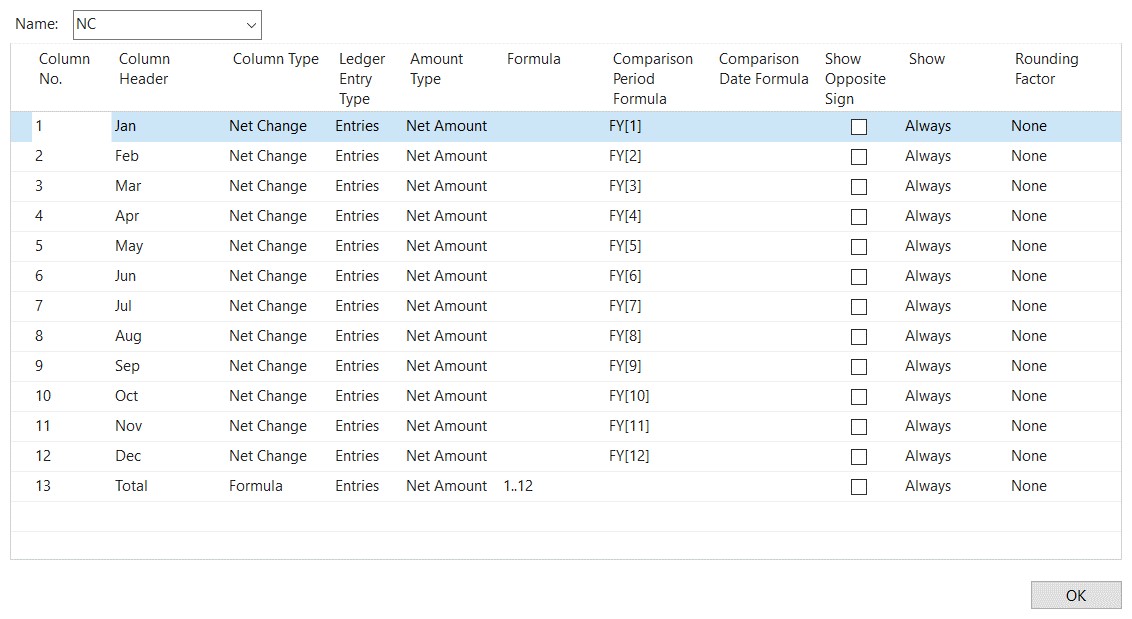
Figure 15 – NC Net Change
NCA (alternative) – Represents the net change for 12 months of the fiscal year. This is typically used for income statements. This is an alternative method as it relies on the Date Filter being set to the last month of the year.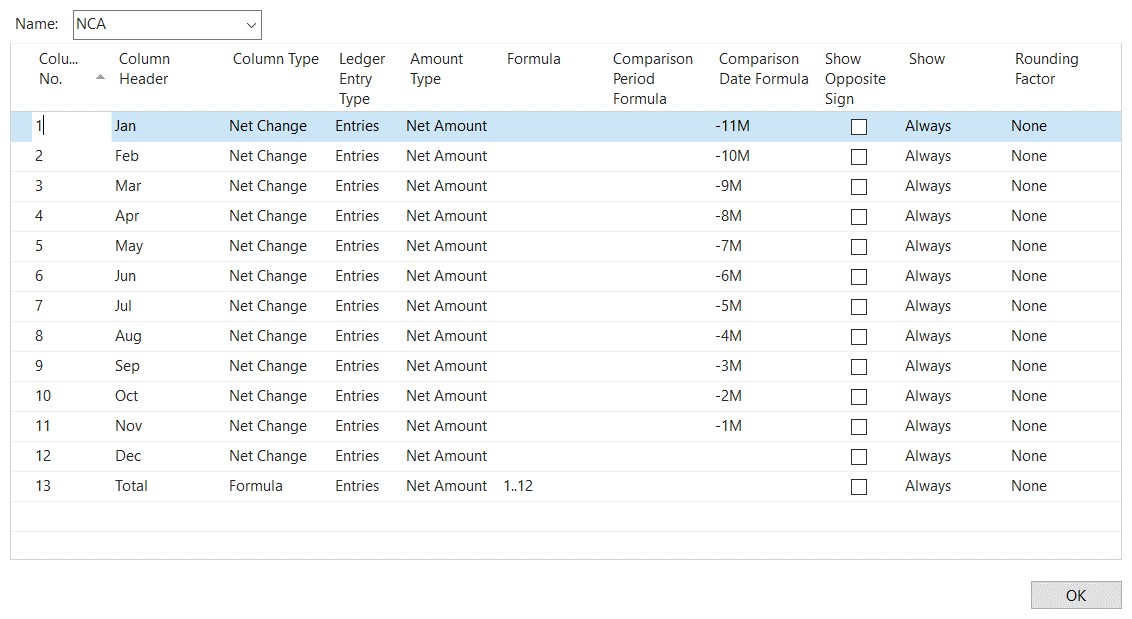
Figure 16 – NCA Net Change (Alternative)
PERIODS – Represents the current period and two prior periods.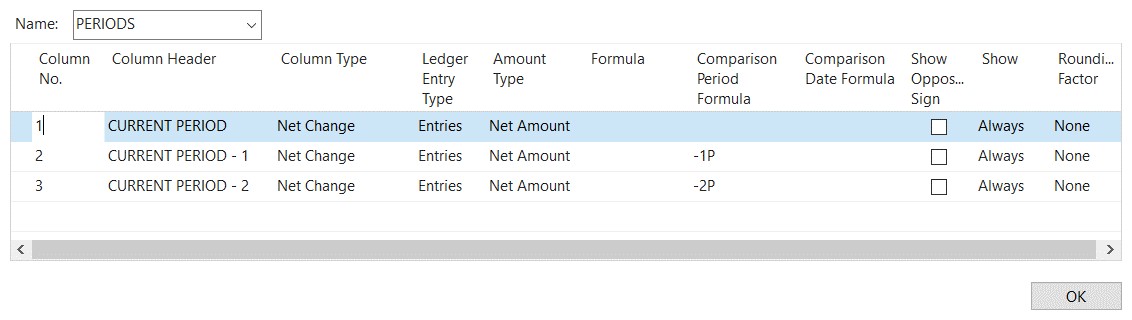
Figure 17 – PERIODS Periods Definition for Mini Charts
PTD + YTD – Represents the period to date and the year to date net change.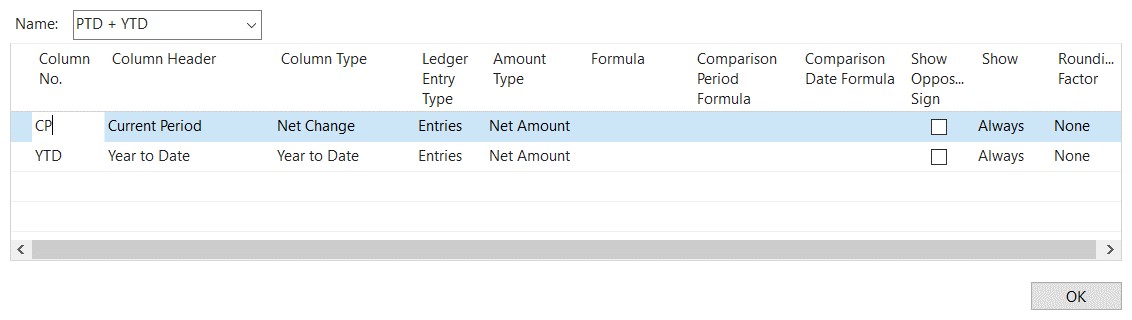
Figure 18 – PTD + YTD Period and Year to Date
PTD + YTD + % – Represents the period and year to date percentage of the budget.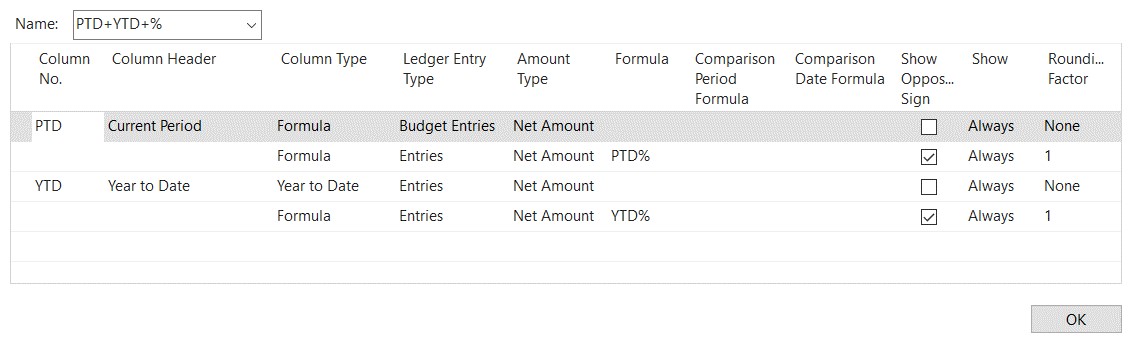
Figure 19 – PTD + YTD + % Period and Year to Date with Percent of Total Revenue
PYTD – Represents the balance of one fiscal year prior to the Date Filter.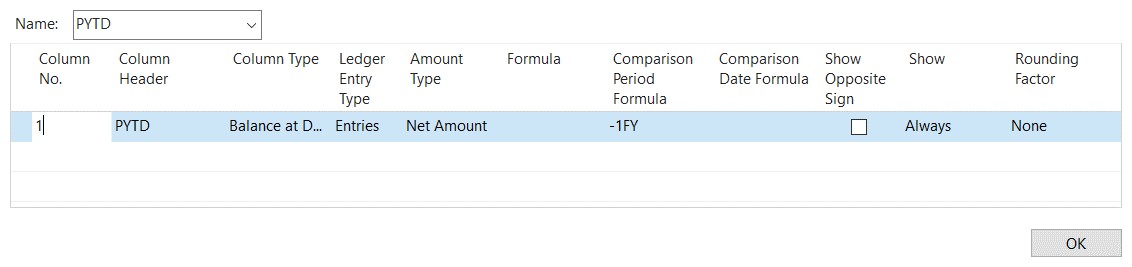
Figure 20 – PYTD Prior Year to Date
PYTDA (alternative) – Represents the balance of one fiscal year prior to the Date Filter.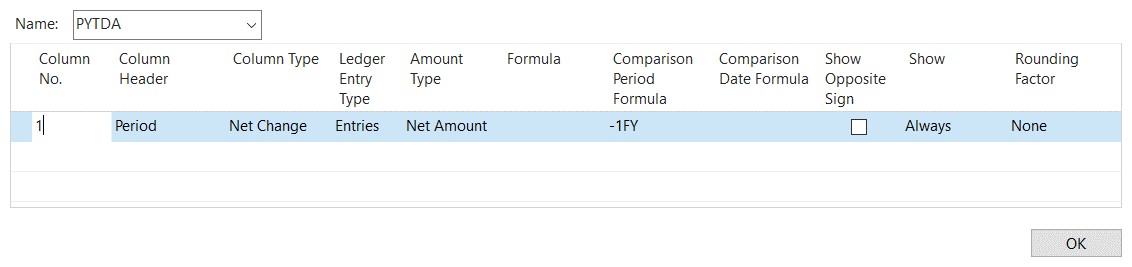
Figure 21 – PYTD Prior Year to Date (Alternative)
QP – Represents a column for each quarter of net change.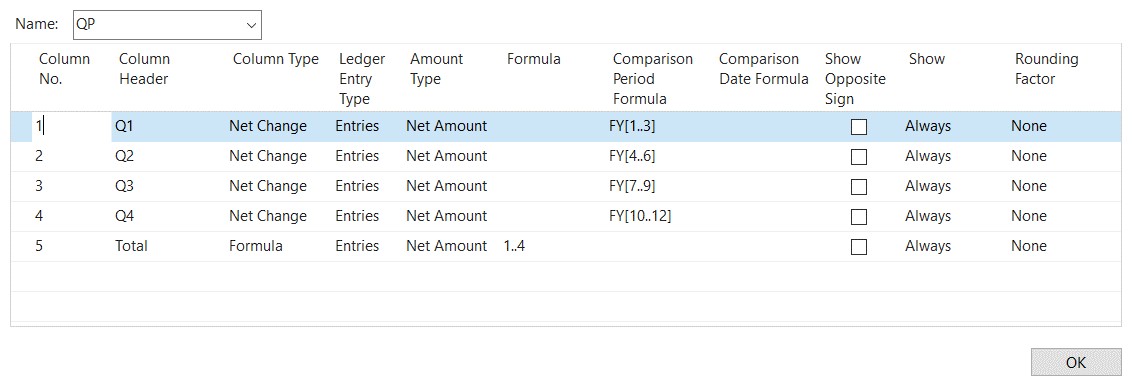
Figure 22 – QP Quarterly Period
RFY – Represents the remaining amount for the fiscal year. This is typically used for budget entries.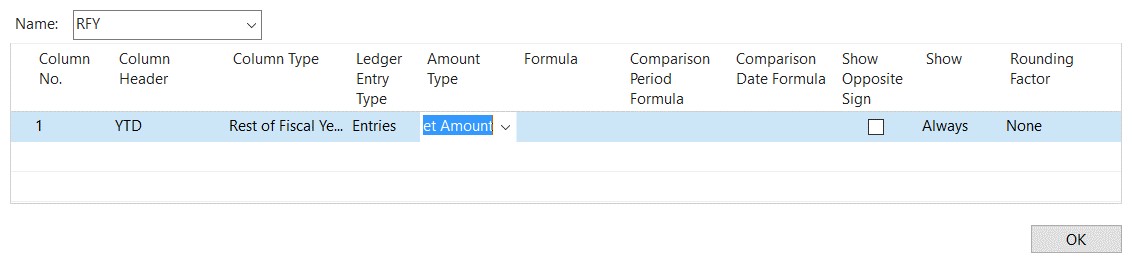
Figure 23 – RFY Rest of Fiscal Year
SMP – Represents the first six periods of the current fiscal year summarized in one column.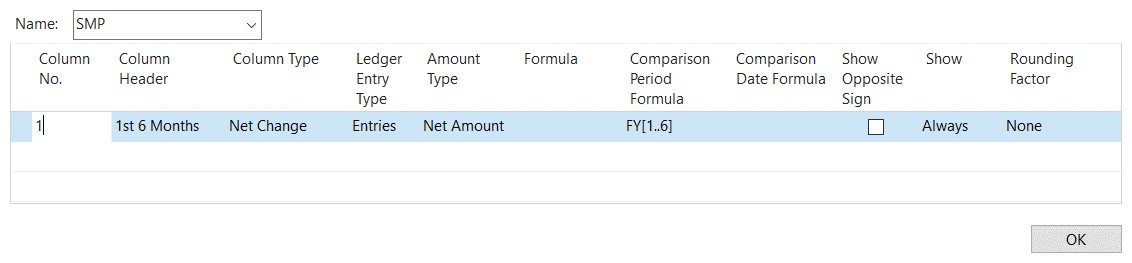
Figure 24 – SMP Specific Multiple Periods
SP6 – Represents a specific period regardless of the Date Filter. In this example, the period for June is used.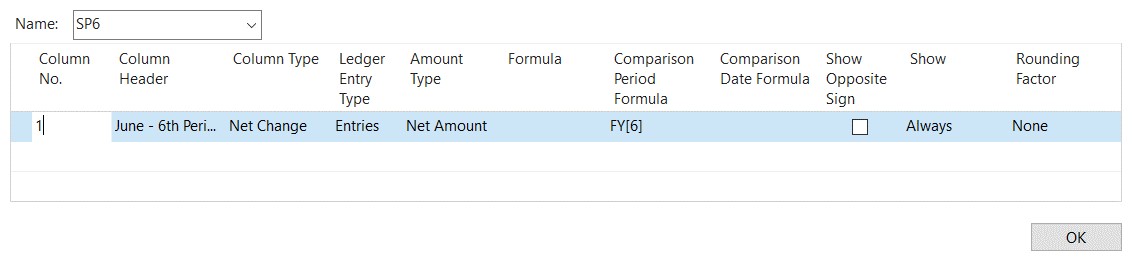
Figure 25 – SP6 Specific Period – June
SPPY – Represents the same period of the prior fiscal year, based on the Date Filter.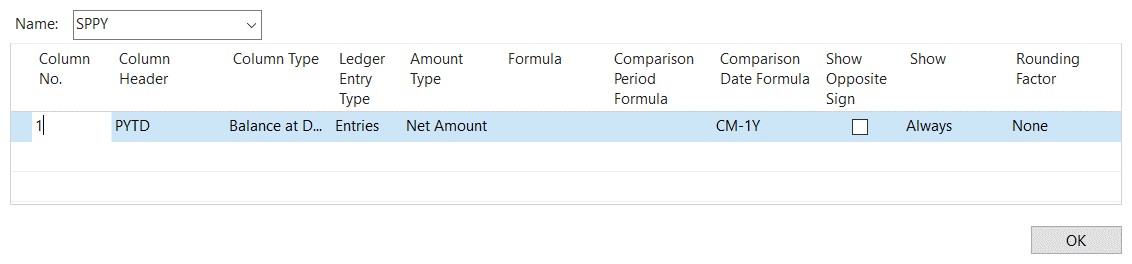
Figure 26 – Same Period of Prior Year
SP-PY – Represents a specific period in the prior fiscal year regardless of the Date Filter.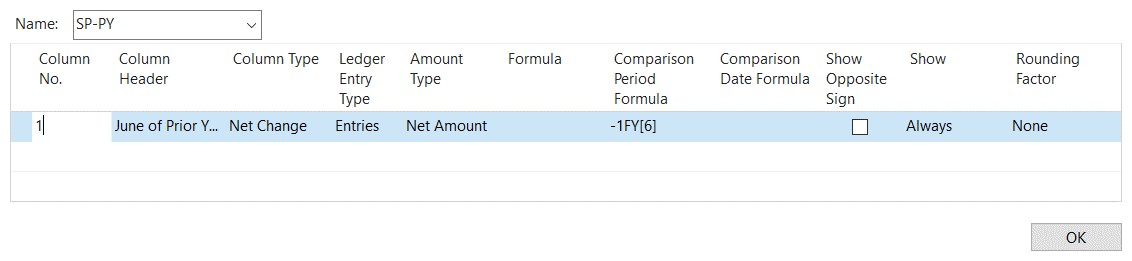
Figure 27 – SP-PY Specific Period of Prior Year – June
WK – Represents the previous 7 days. The Date Filter must be set to the last day of the week.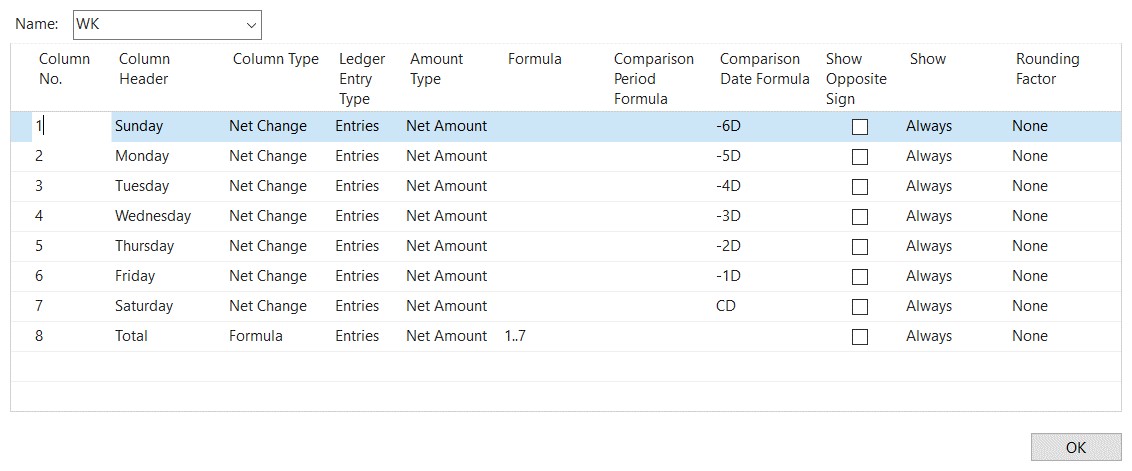
Figure 28 – WK Last Seven Days
YTD – Represents the year to date depending on the Date Filter. If the Date Filter is set to June, the report will display data from January to June.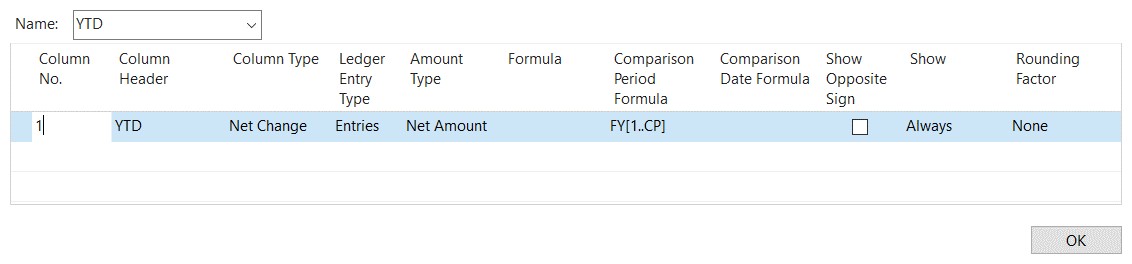
Figure 29 – YTD Year to Date
YTDA (alternative) – Represents the year to date depending on the Date Filter. If the Date Filter is set to June, the report will display data from January to June.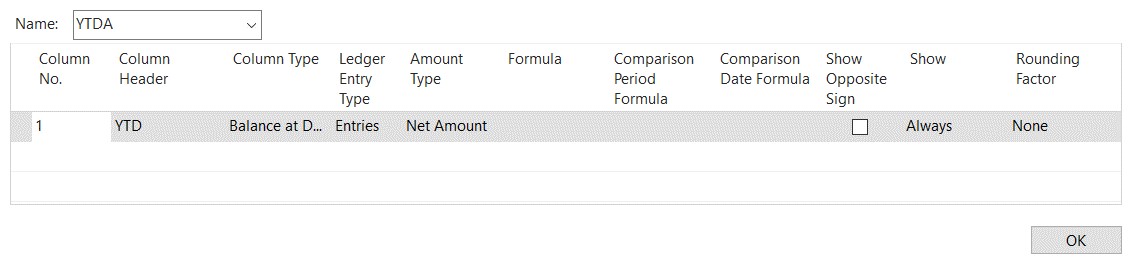
Figure 30 – YTDA Year to Date (Alternative)
YTDCOMPARE – Represents the year to date activity compared to the prior year.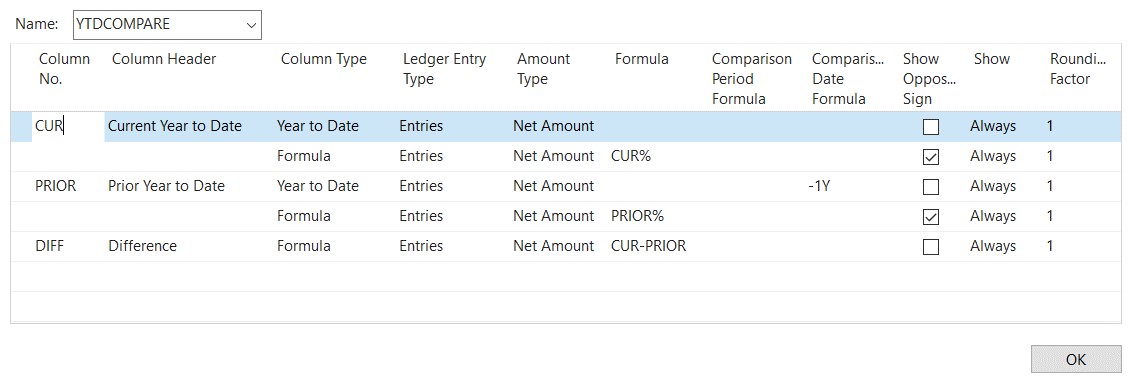
Figure 31 – YTDCOMPARE This Year to Date vs. Prior Year to Date
The following Column Layouts will need to be created for each of the day of the month options.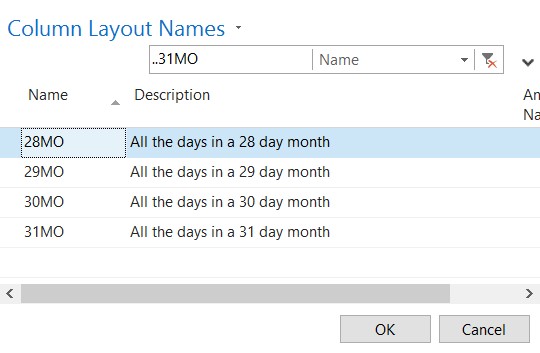
Figure 32 – Column Layout Names
31MO – Represents each of the days in a given month. The Date Filter must be set to the last day of the month.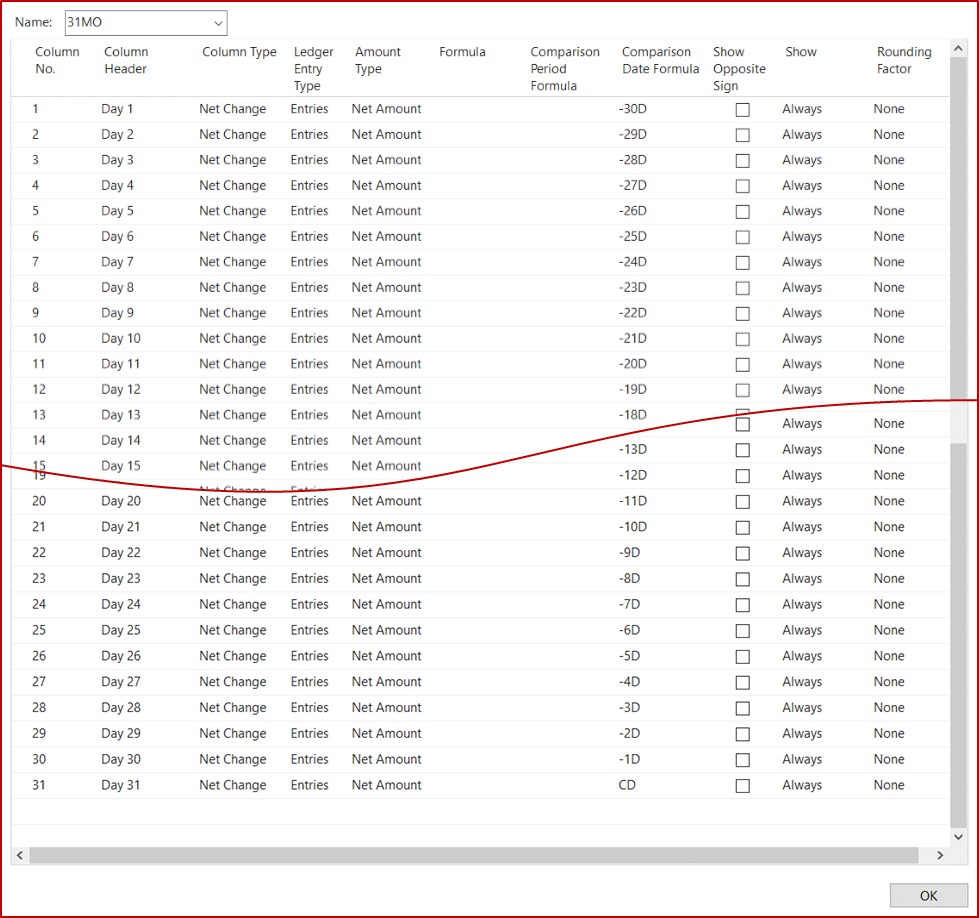
Figure 33 – 31MO All the Days in a 31 Day Month
Check out our blog for more information on setting up columns in Dynamics NAV.
And, be sure to subscribe to our blog so you’ll never miss another NAV-related update.
Trending Posts
- Login Error: Communication protocol mismatch between client and server
- How to Make Measures Total Correctly in Power BI Tables
- The Microsoft Technology Stack – What Is It & Why Should You Care?
- MRP vs. MPS: Choosing the Right Planning Approach for Your Manufacturing Business
- Guide to How Manufacturers Can Implement Quality Control Systems Using Business Central
Stay Informed
Choose Your Preferences
"*required" indicates required fields